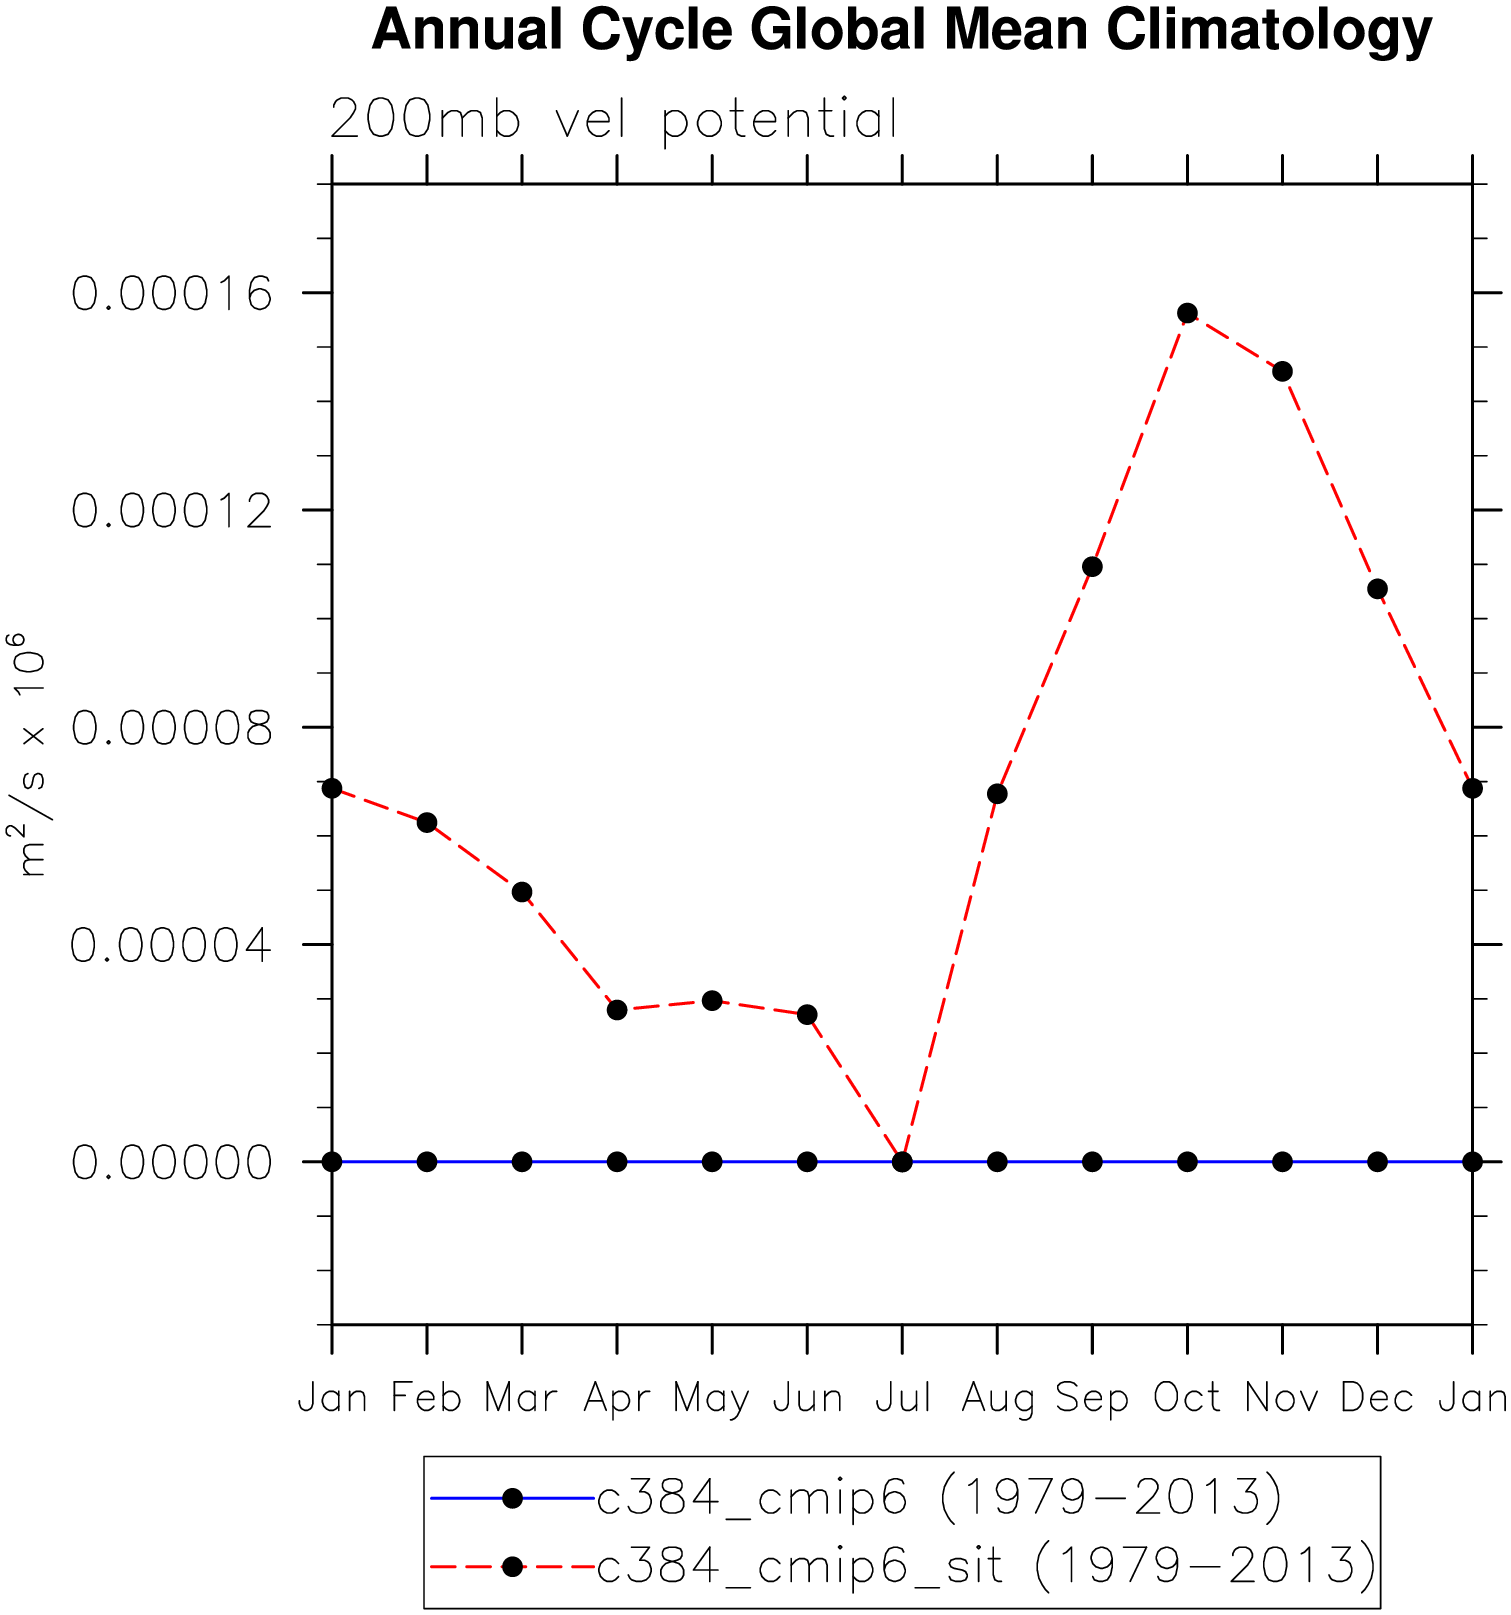
c384_cmip6_sit
and
c384_cmip6
DIAG Set 10 - Annual cycle line plots of global means
Surface Variables
PSL
Sea level pressure
plot
TREFHT
2-meter air temperature
plot
TS
Surface temperature
plot
Constant Pressure Levels
CHI 200
200 mb velocity potential
plot
EKE 850
850 mb transient eddy kinetic energy
plot
PSI 200
200 mb stream function
plot
T 850
850 mb temperature
plot
T 200
200 mb temperature
plot
U 200
200 mb zonal wind
plot
Z 500
500 mb geopotential height
plot
Z 300
300 mb geopotential height
plot
Hydrologic Cycle
EP
Evaporation - precipitation
plot
ICEFRAC
Sea-ice area (Northern)
plot
ICEFRAC
Sea-ice area (Southern)
plot
PRECT
Precipitation rate
plot
QFLX
Surface water flux
plot
Surface Energy Fluxes
FLDS
Downwelling longwave flux
plot
FLNS
Net longwave flux
plot
FLNSC
Clearsky net longwave flux
plot
FSDS
Downwelling shortwave flux
plot
FSNS
Net shortwave flux
plot
FSNSC
Clearsky net shortwave flux
plot
LHFLX
Latent heat flux
plot
RESSURF
Residual energy flux
plot
SHFLX
Sensible heat flux
plot
Top of Model Energy Fluxes
FLNT
Net longwave flux
plot
FLNTC
Clearsky net longwave flux
plot
LWCF
Longwave cloud forcing
plot
SWCF
Shortwave cloud forcing
plot
Cloud Variables
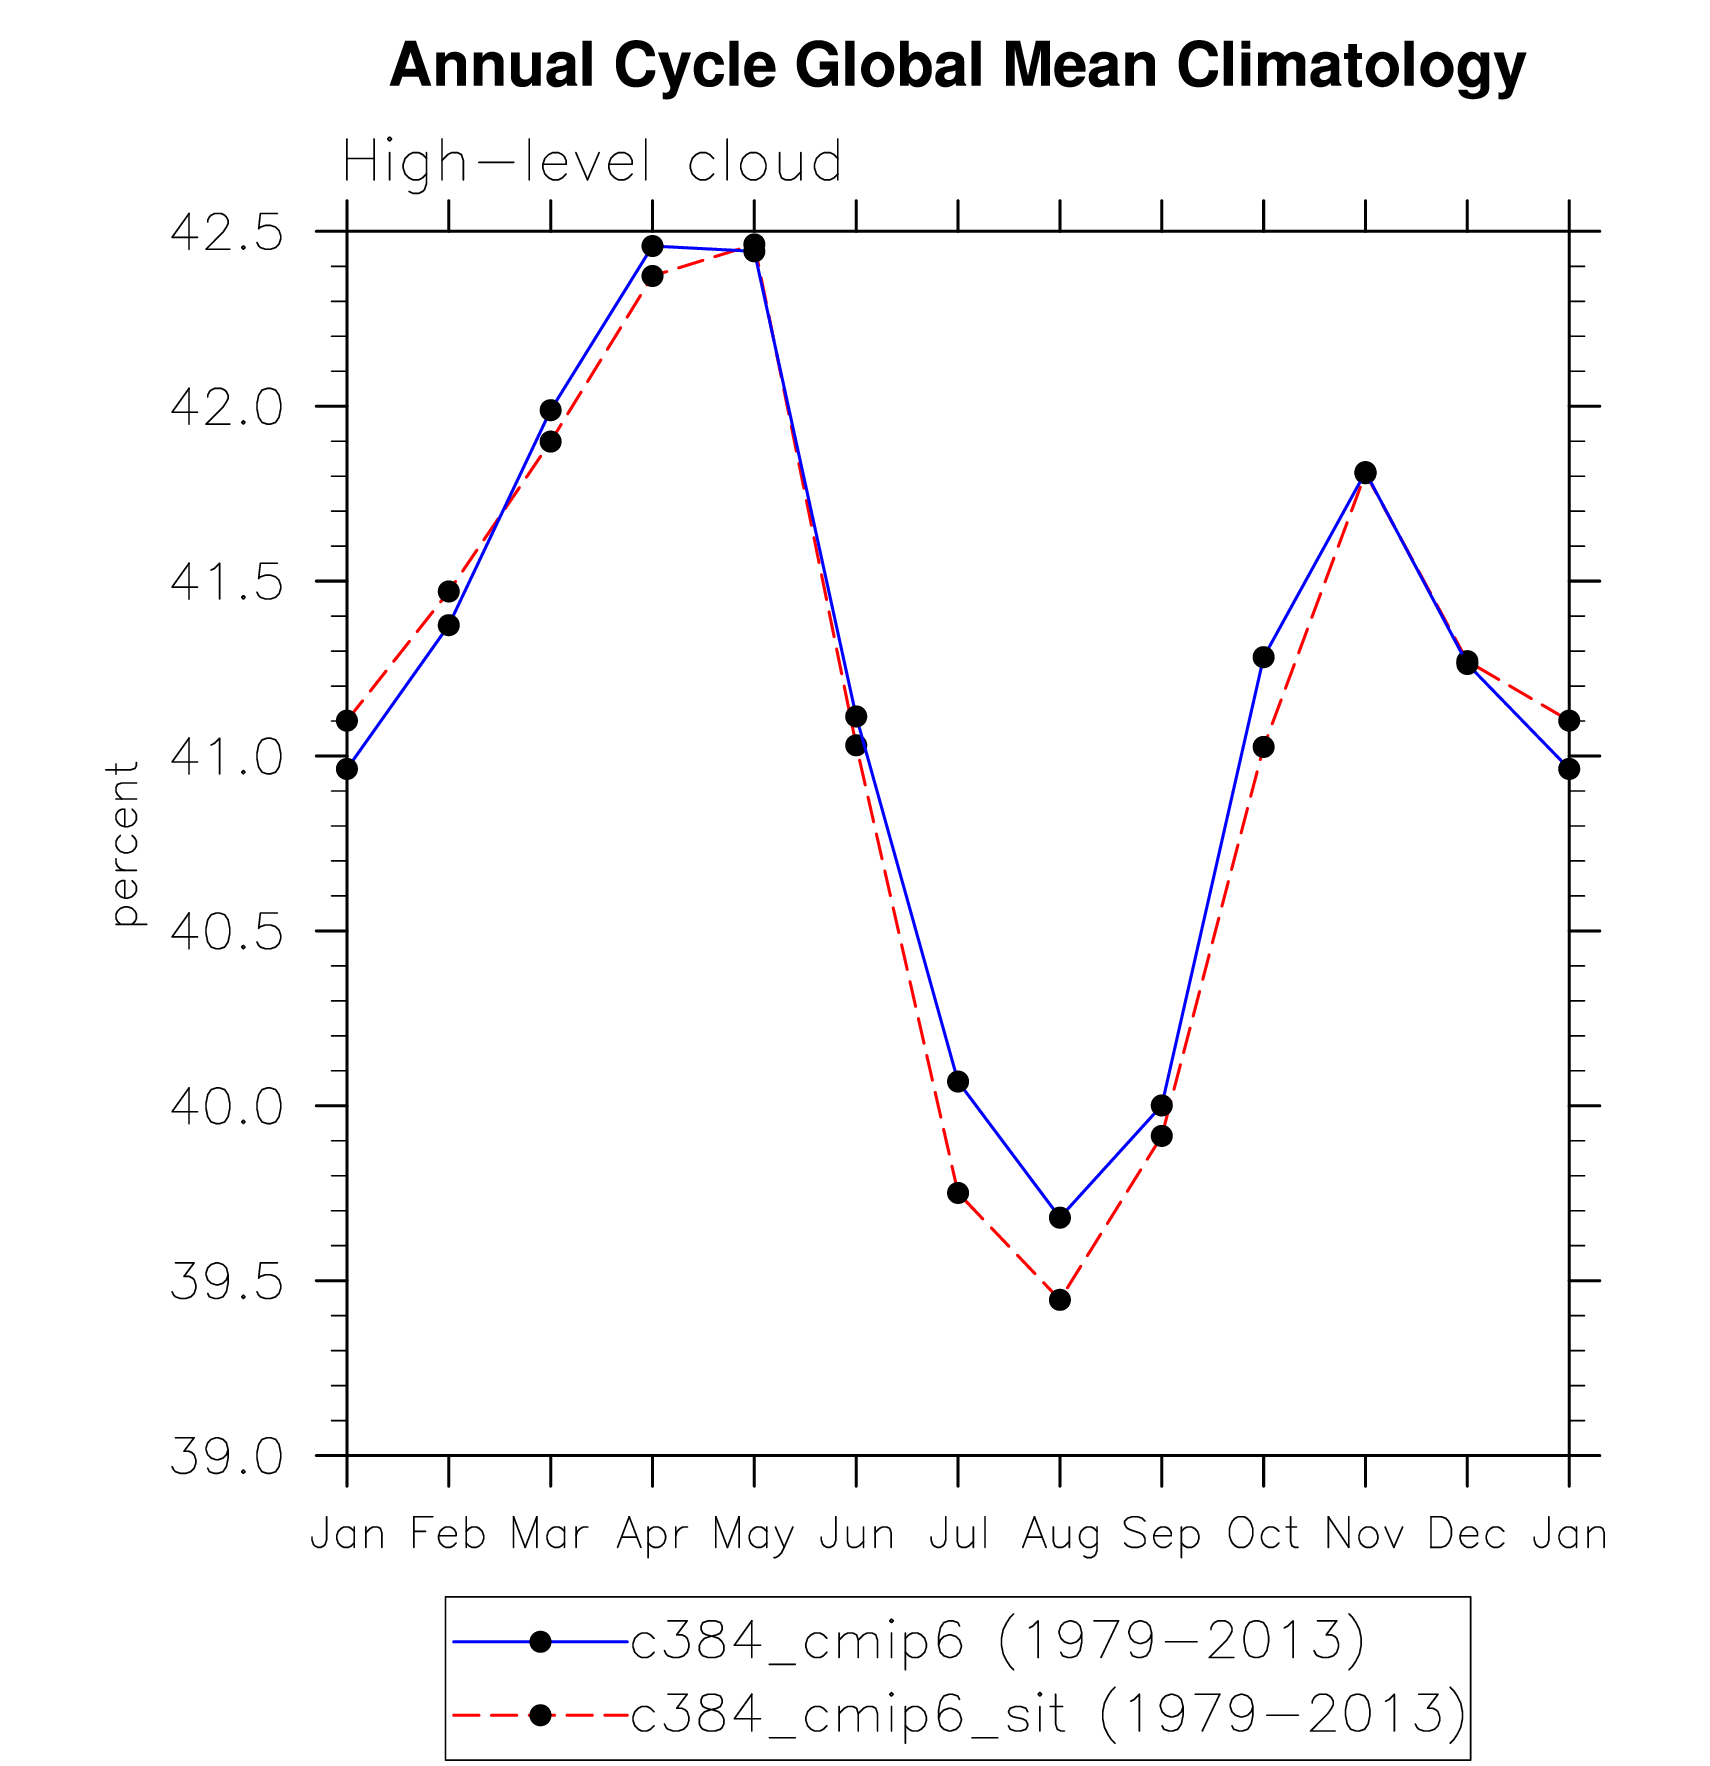
CLDHGH
High-level cloud amount
plot
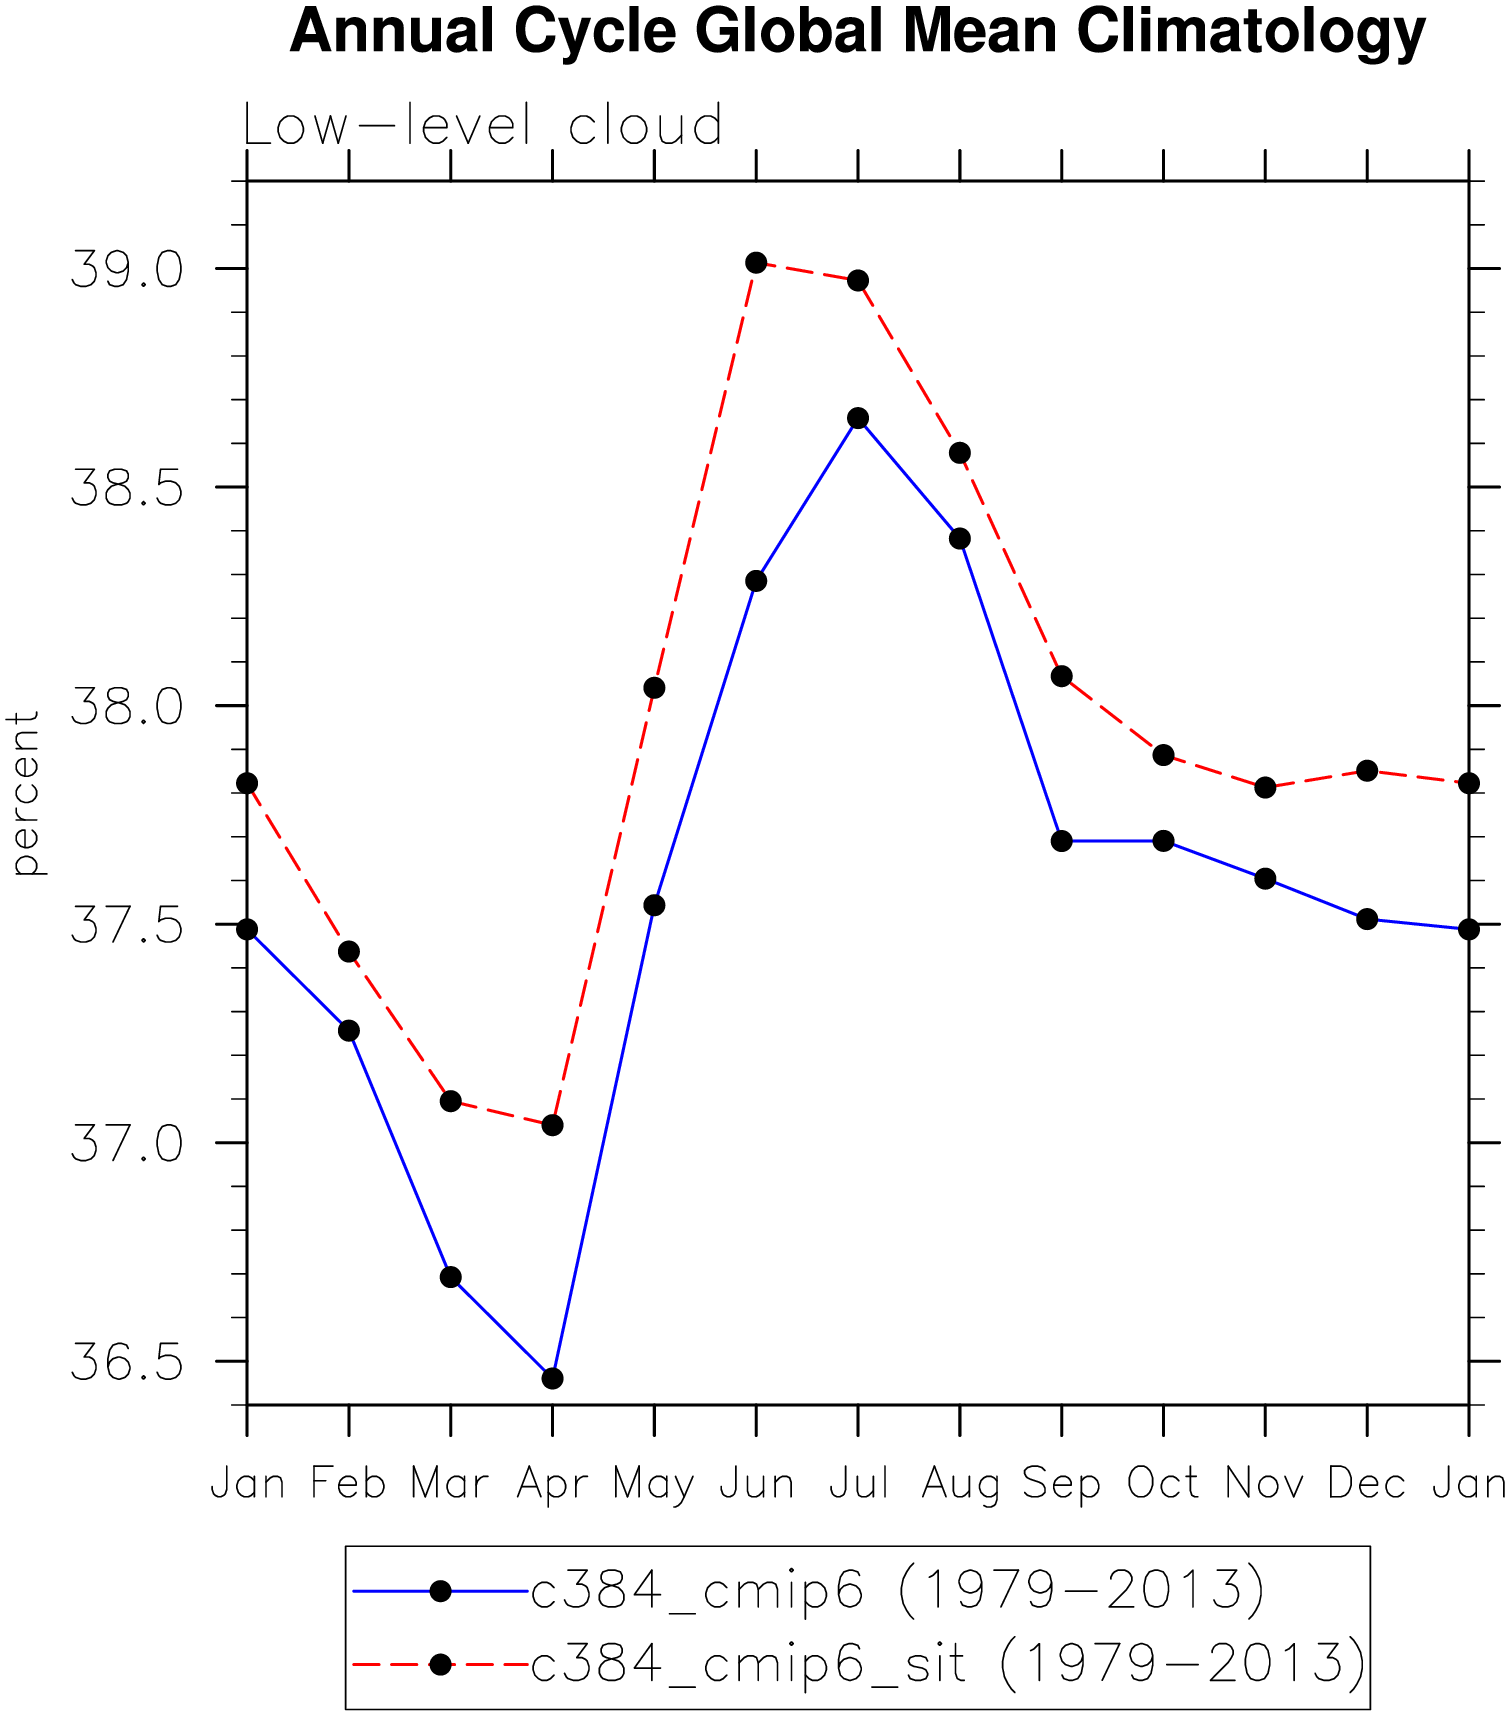
CLDLOW
Low-level cloud amount
plot
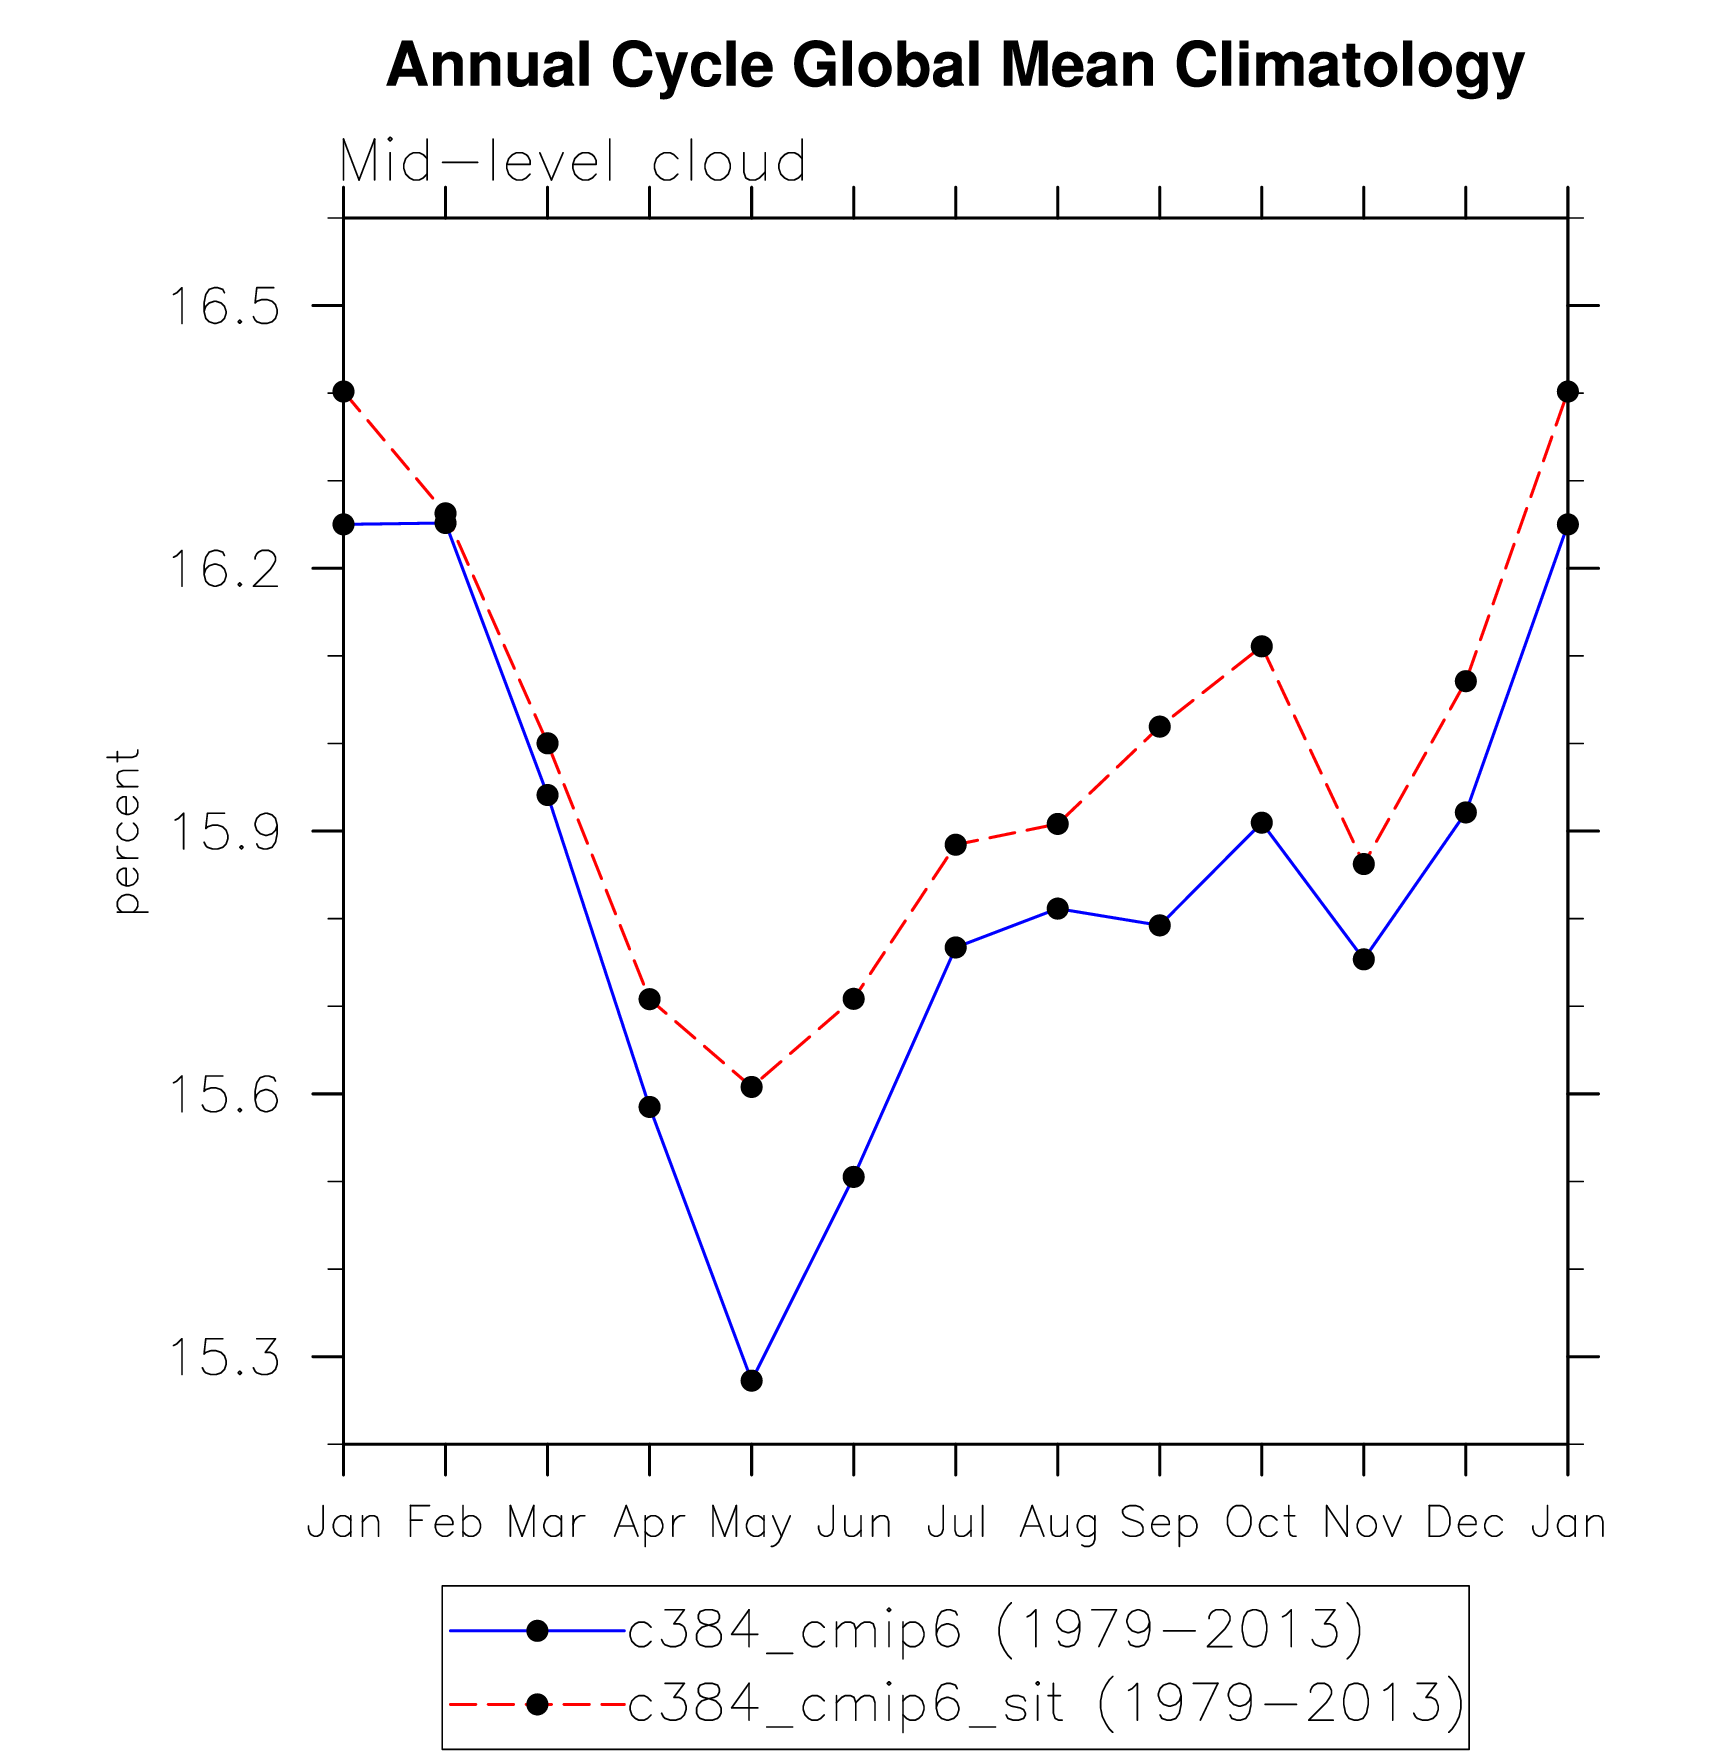
CLDMED
Mid-level cloud amount
plot
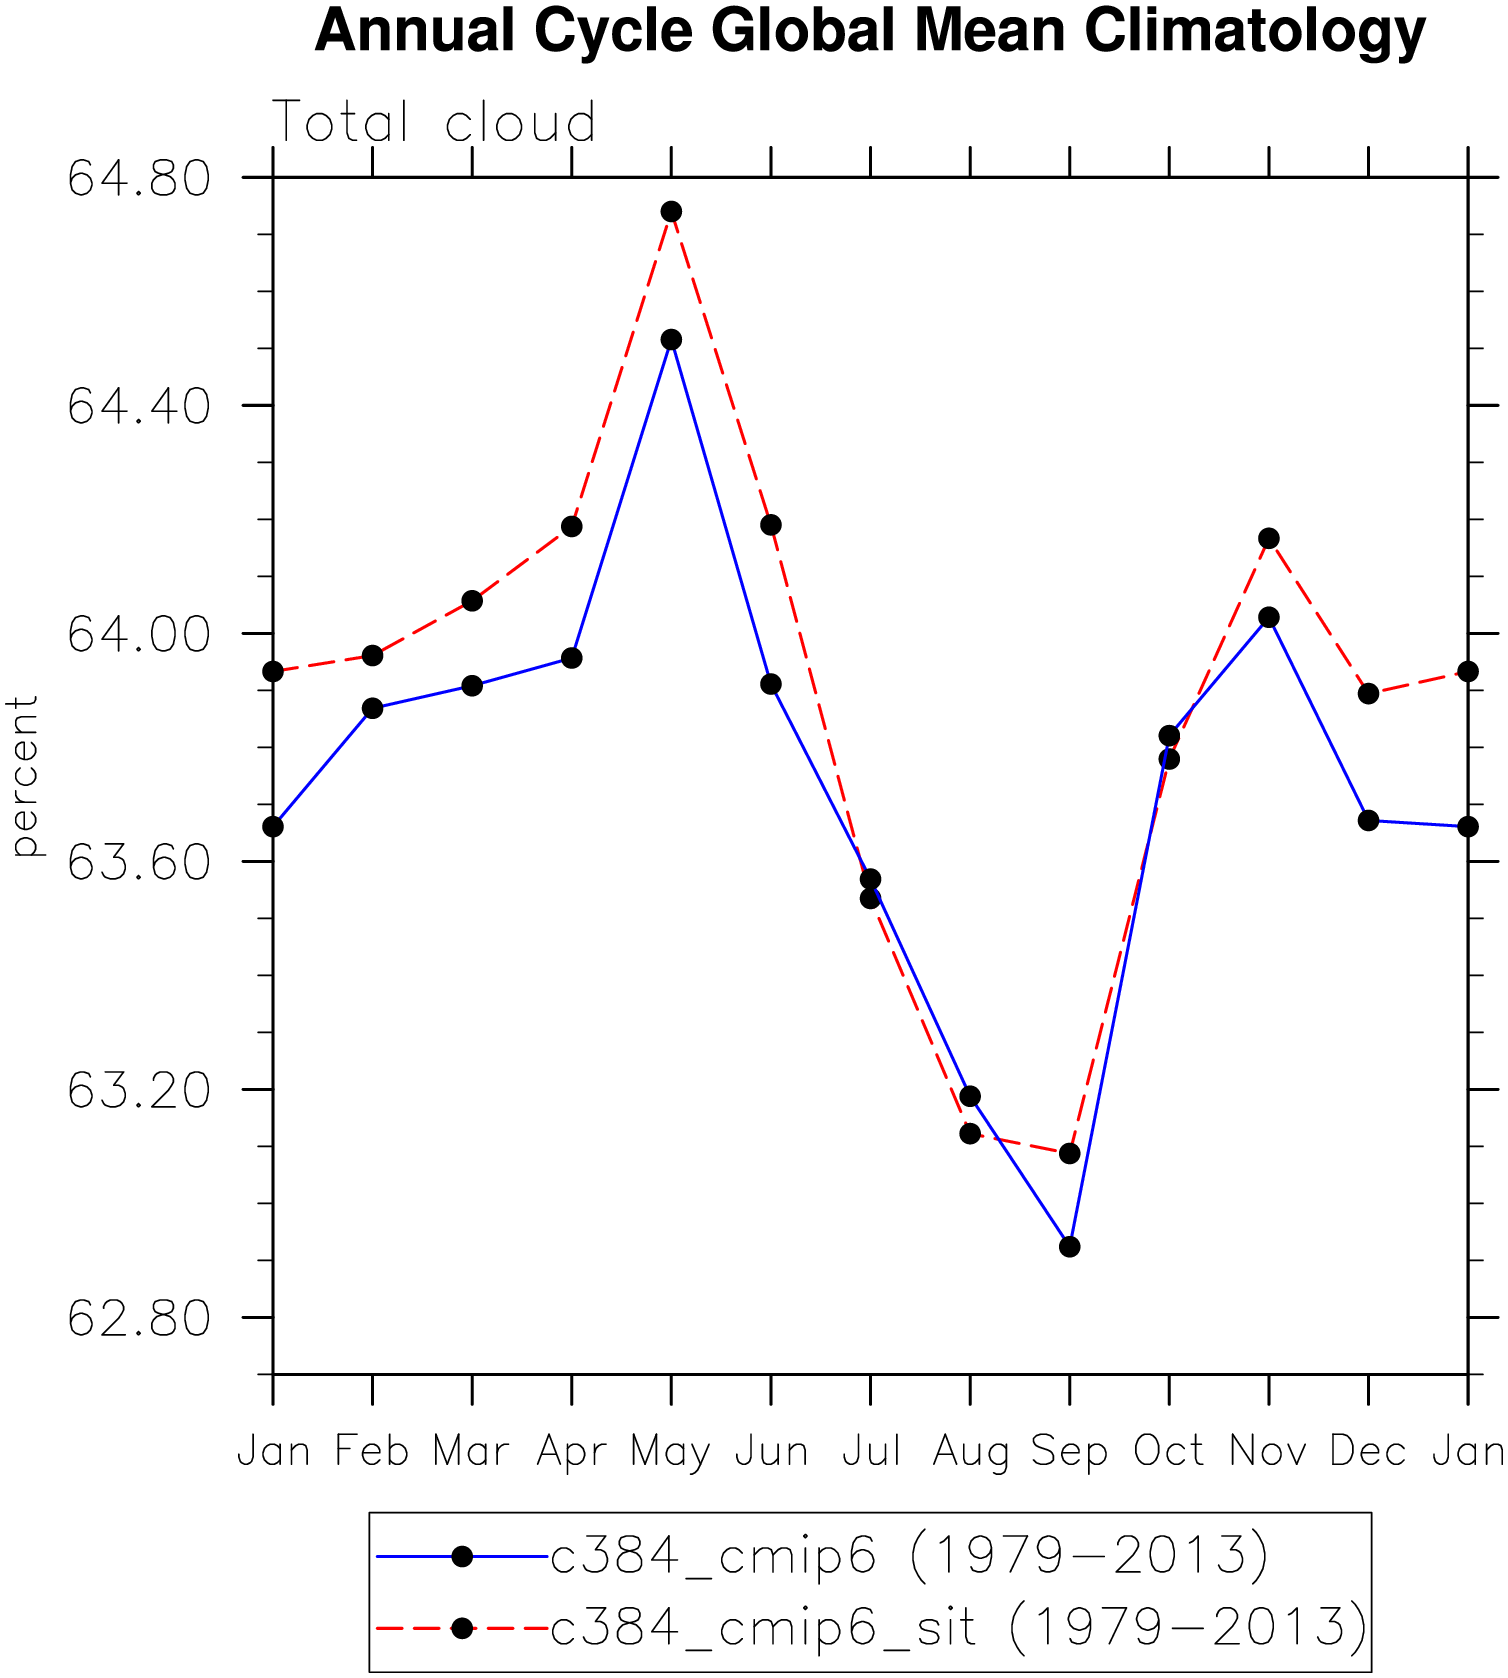
CLDTOT
Total cloud amount
plot