C96_t232.B1850.C6noCB.MG2.GTSC-cl04-TFZM-SNAP.cesm3b06.tn01
and
f09.B-PI.tn15.cmip6.j01.re
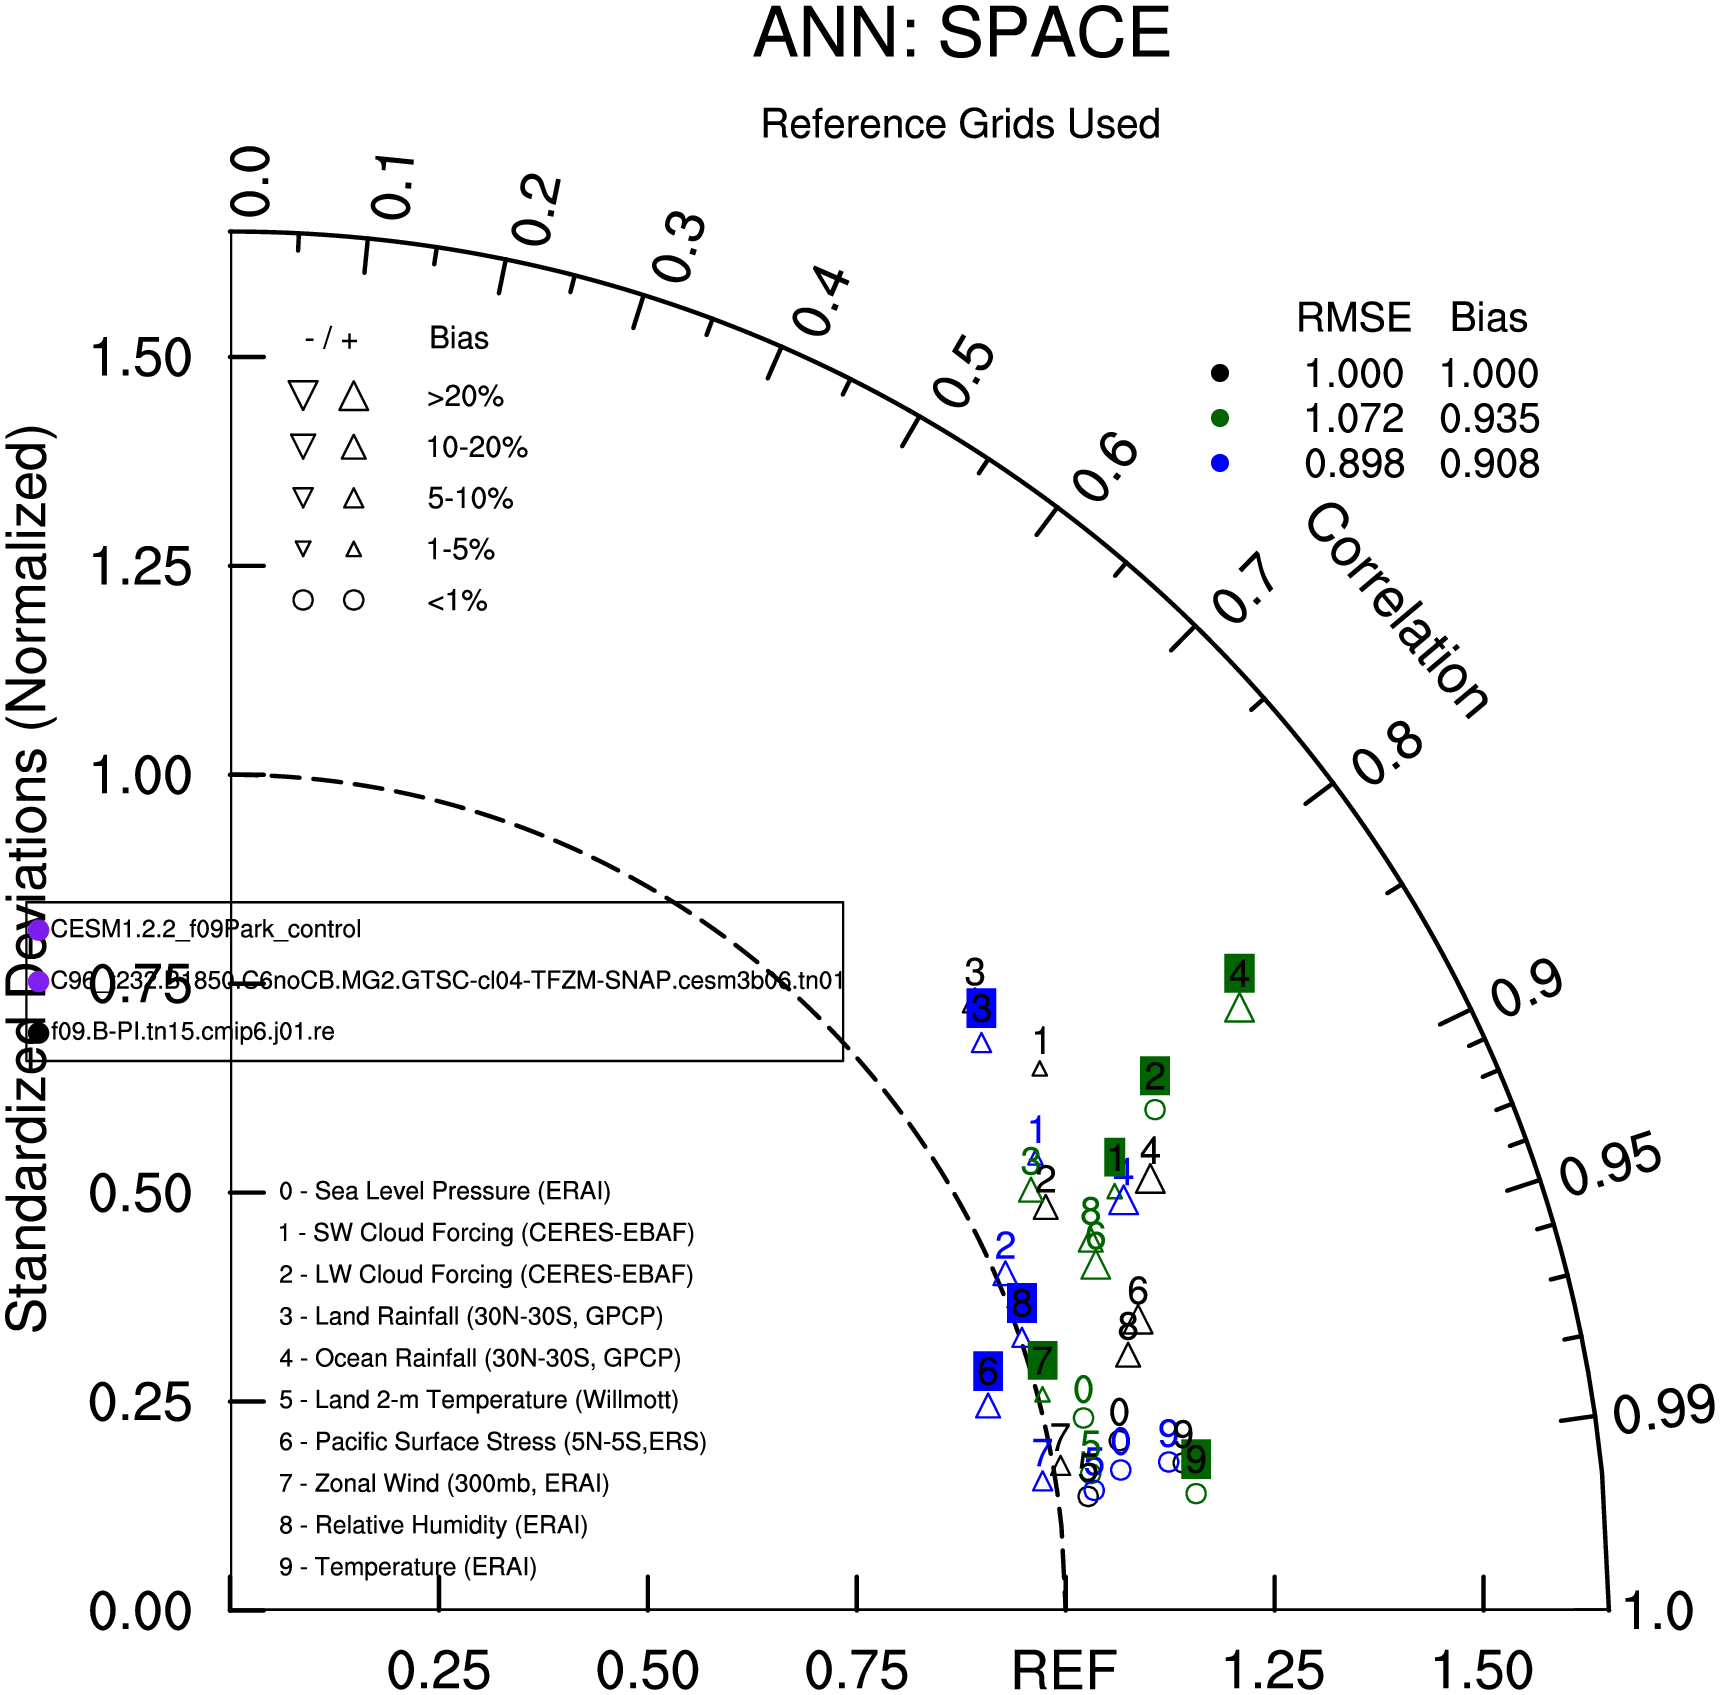
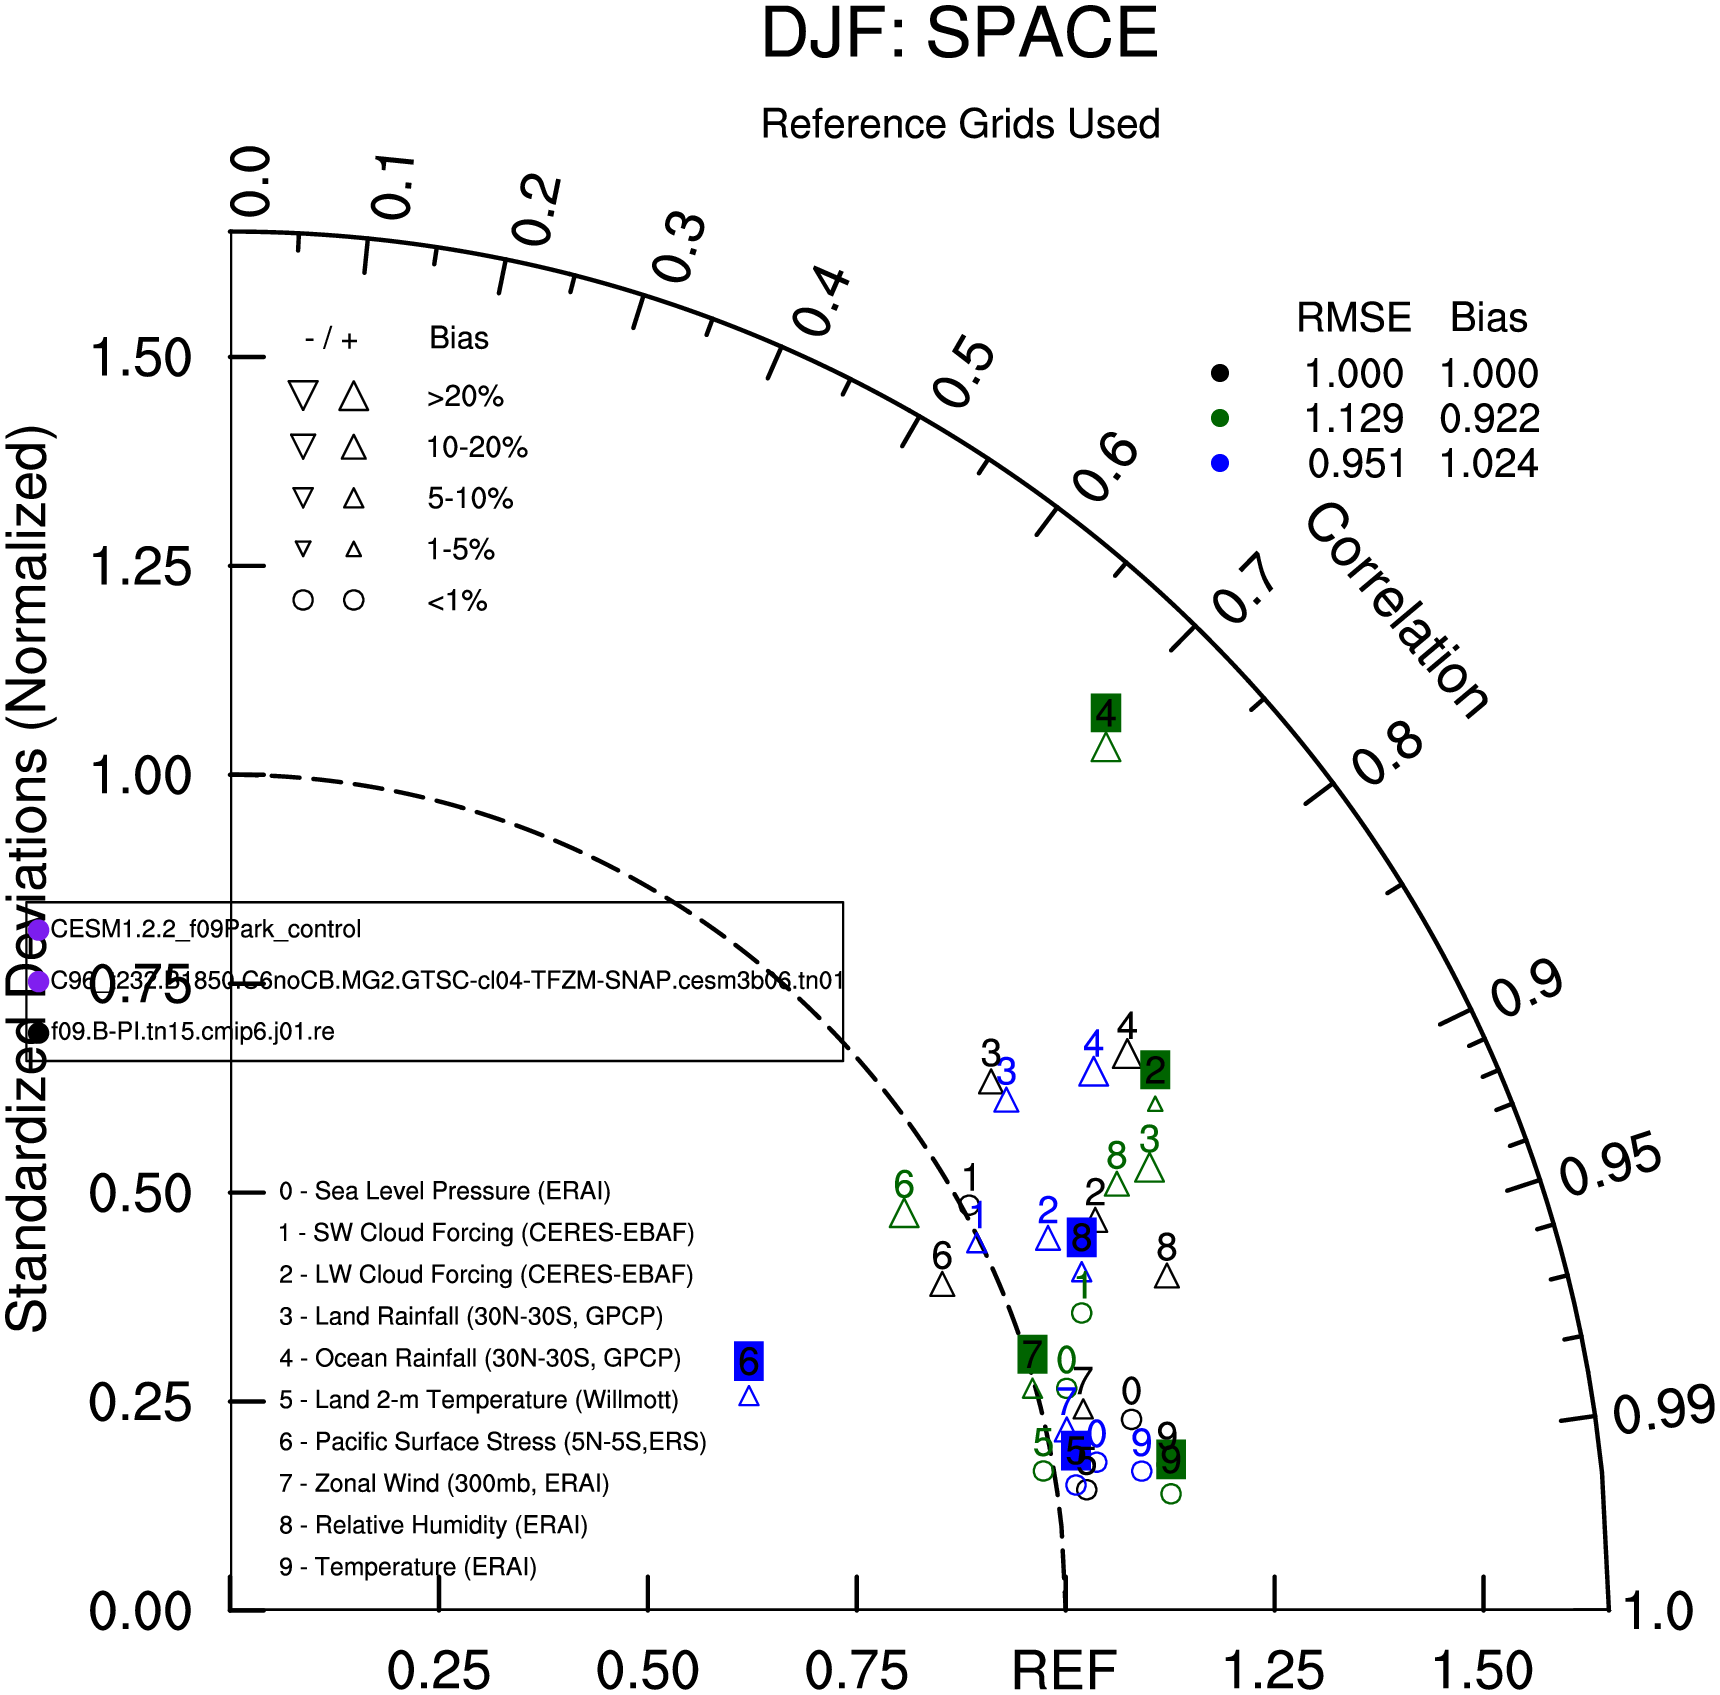
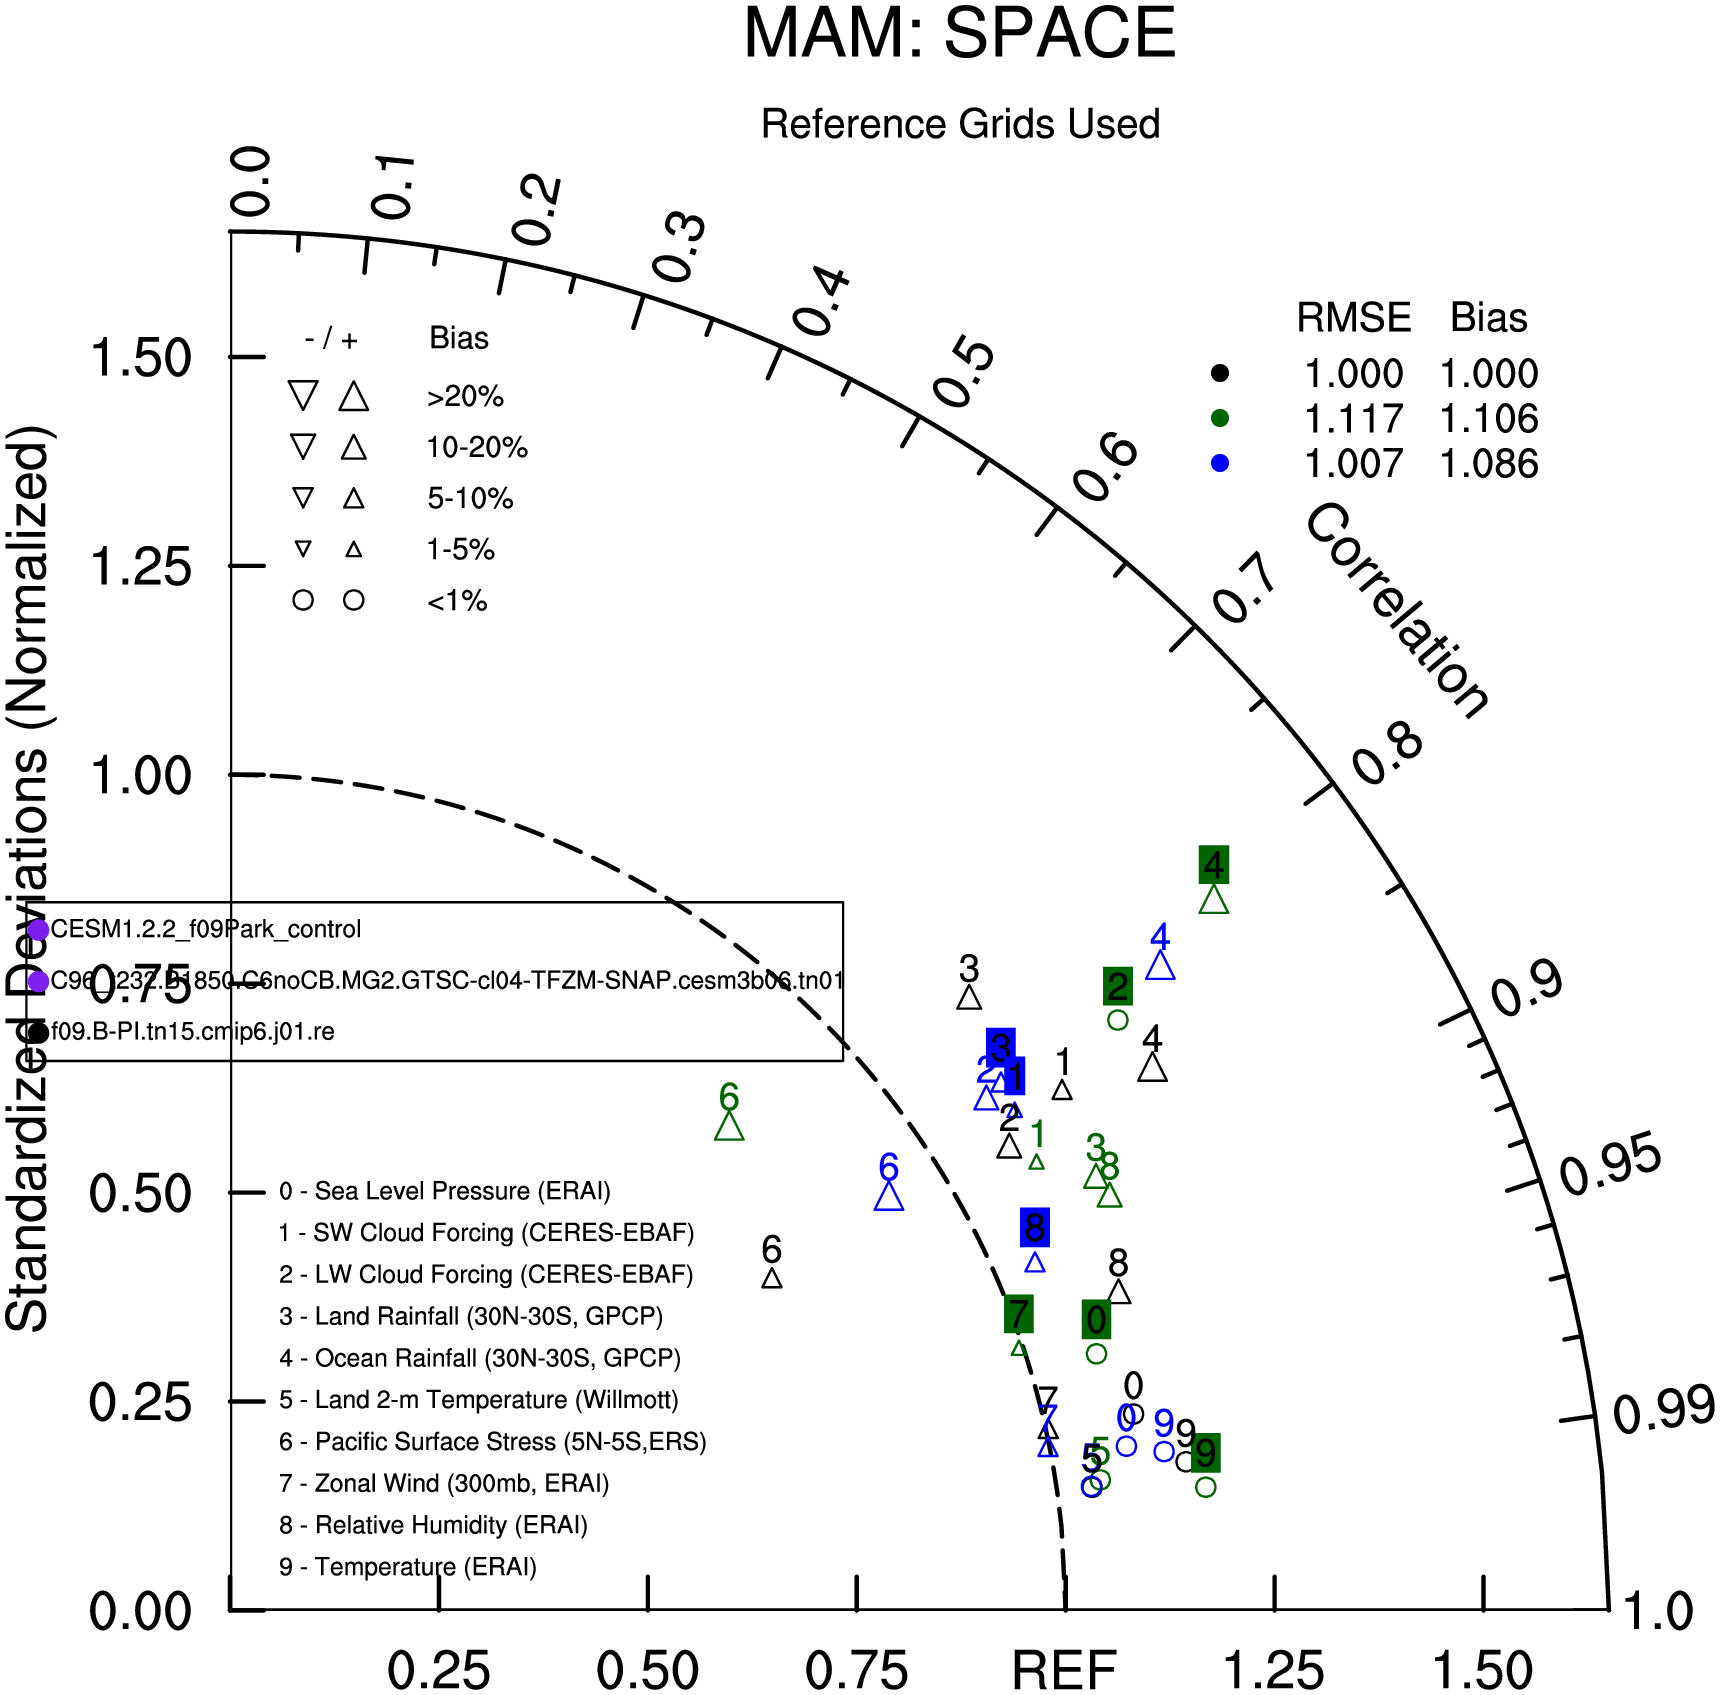
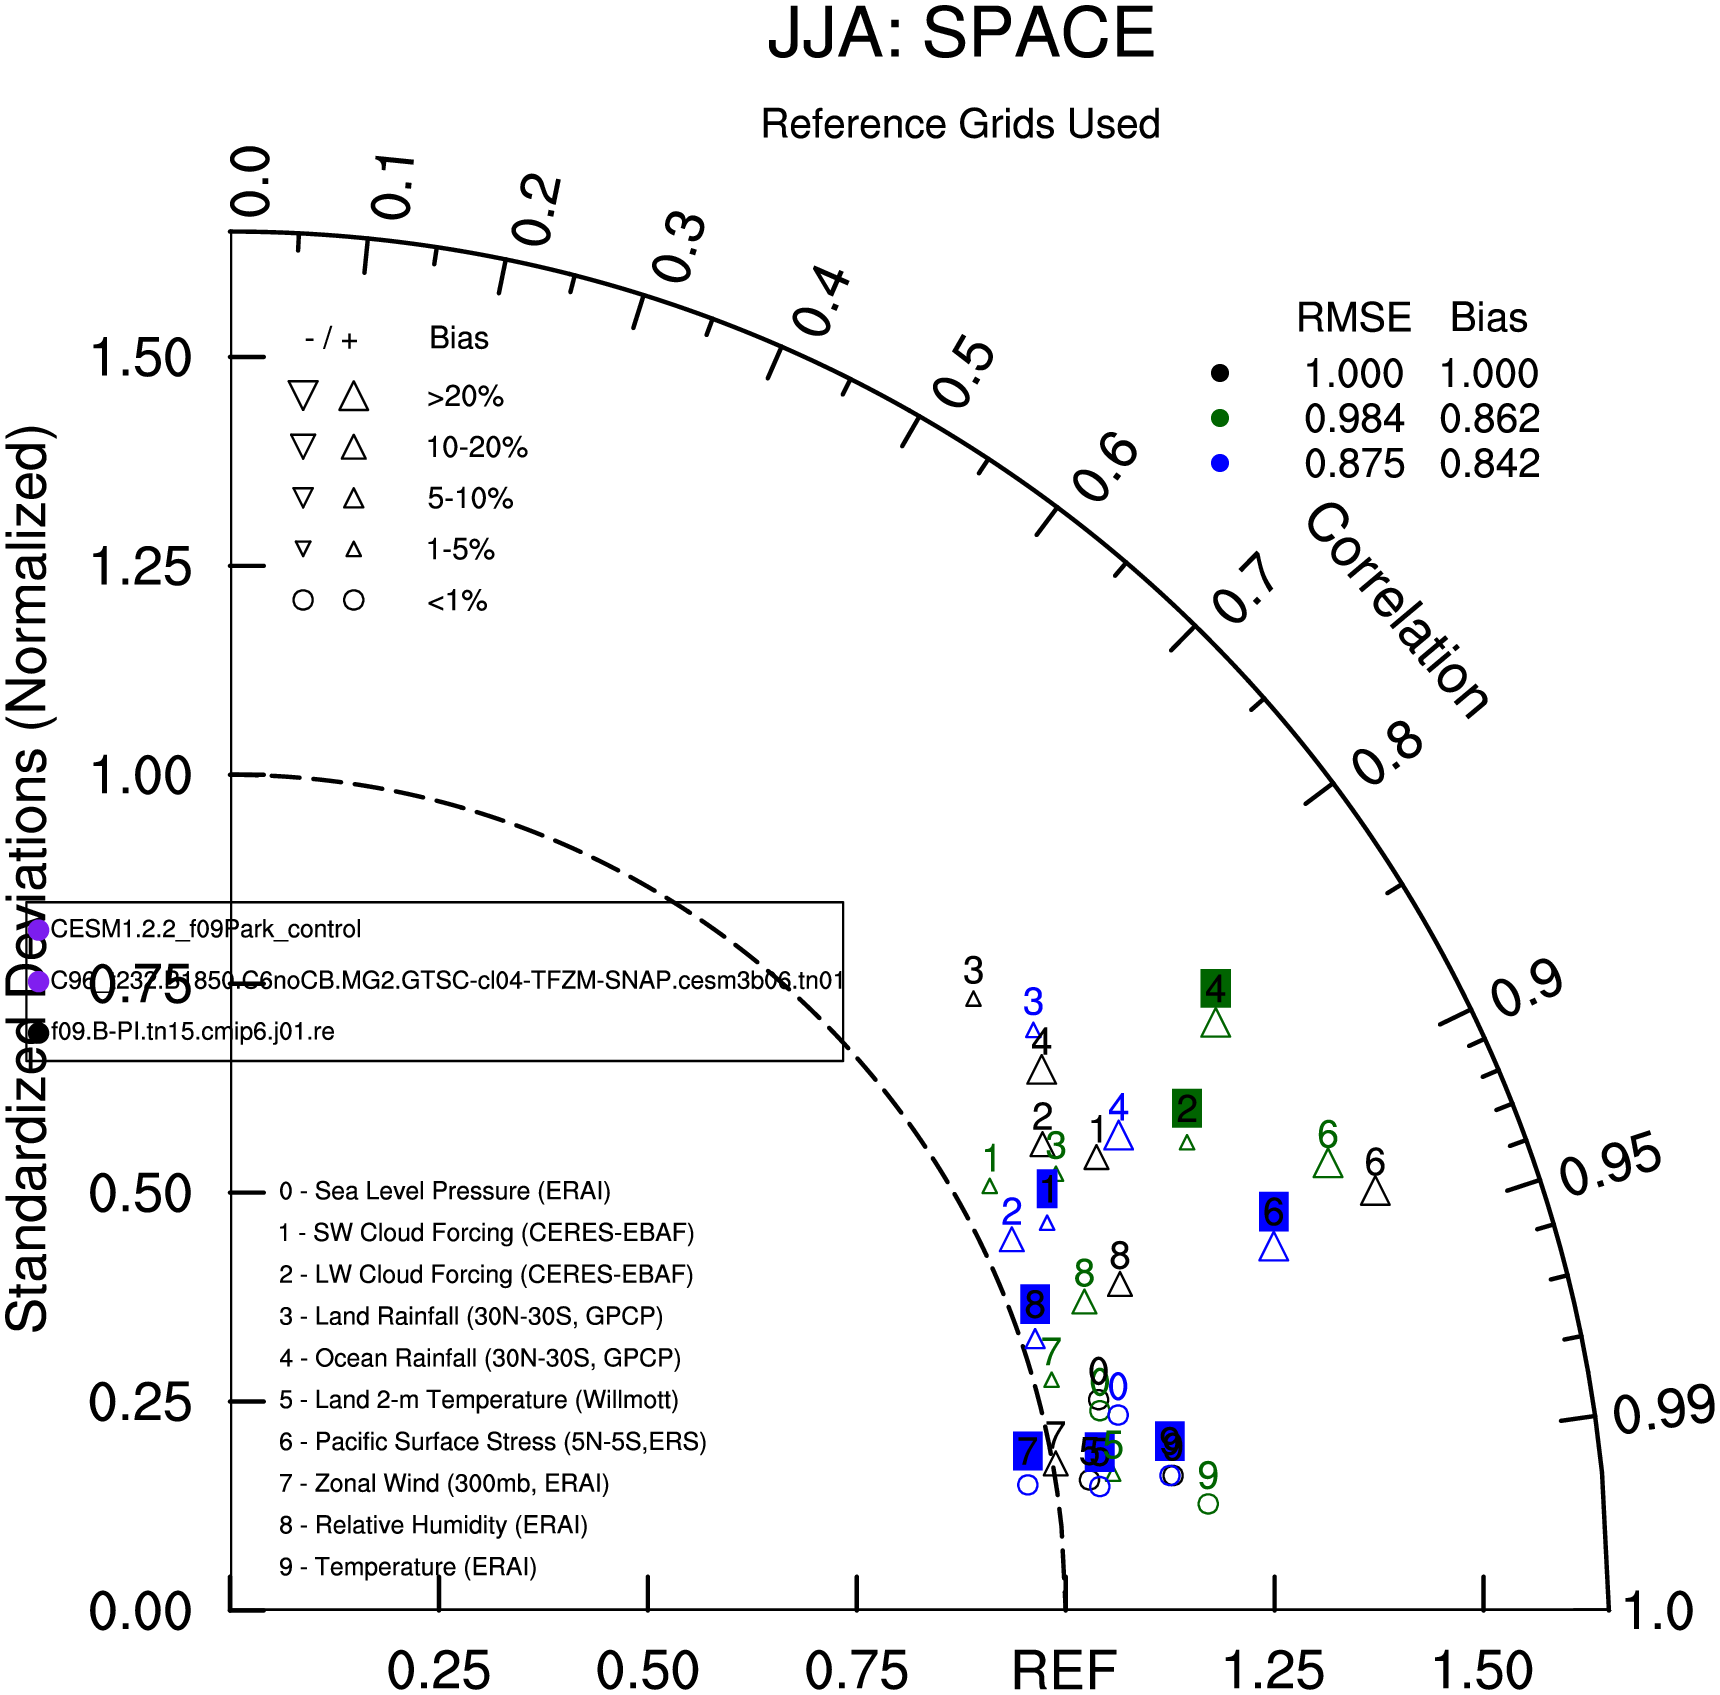
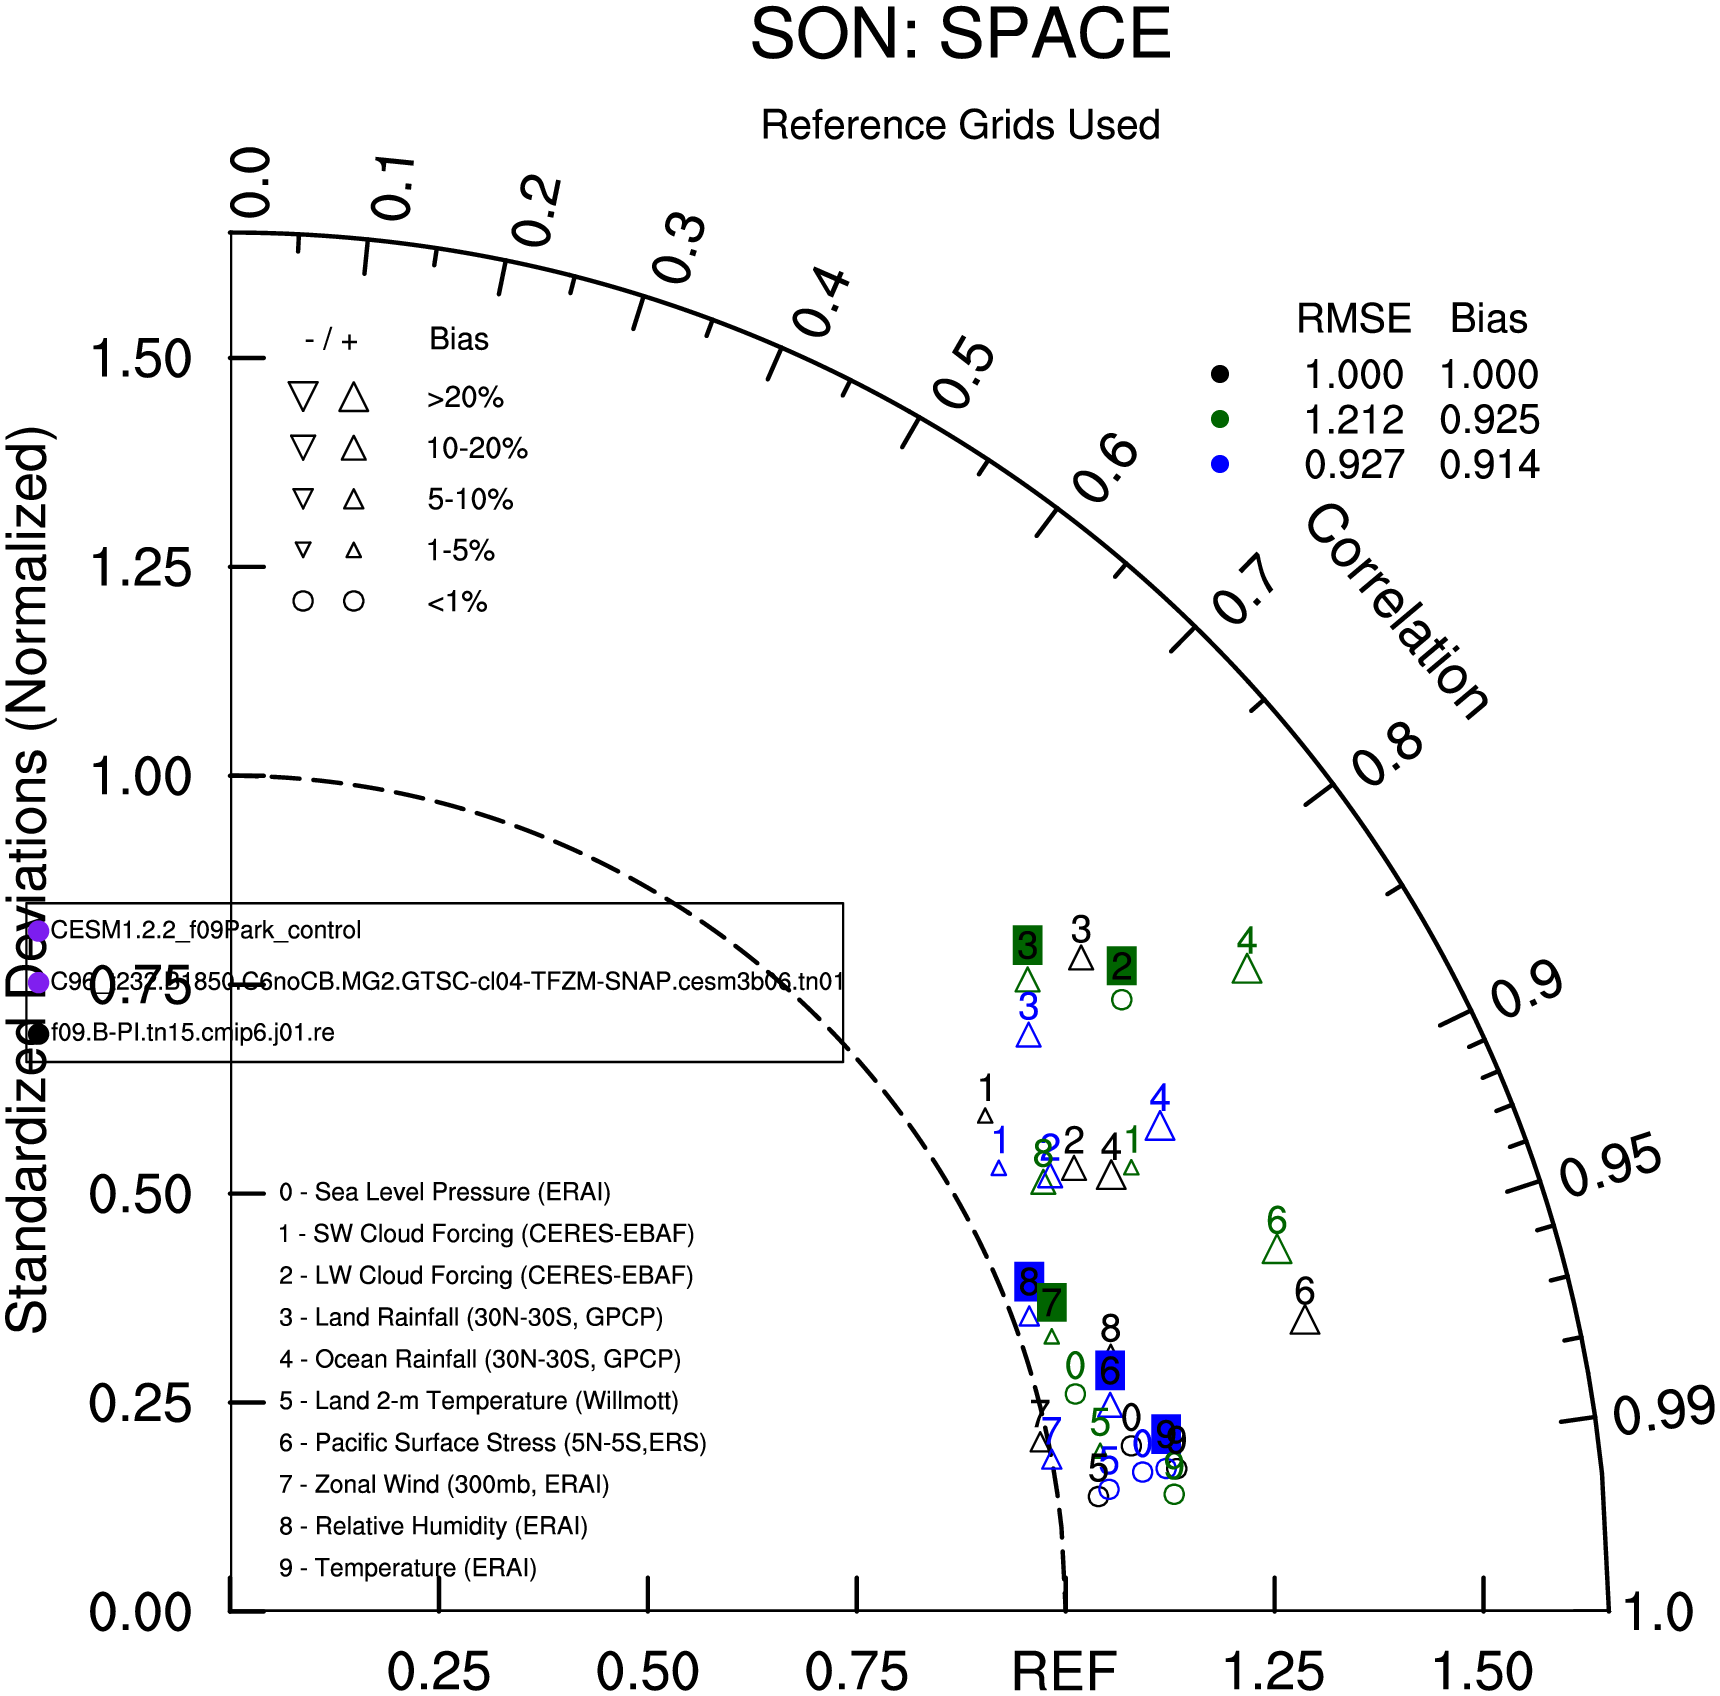
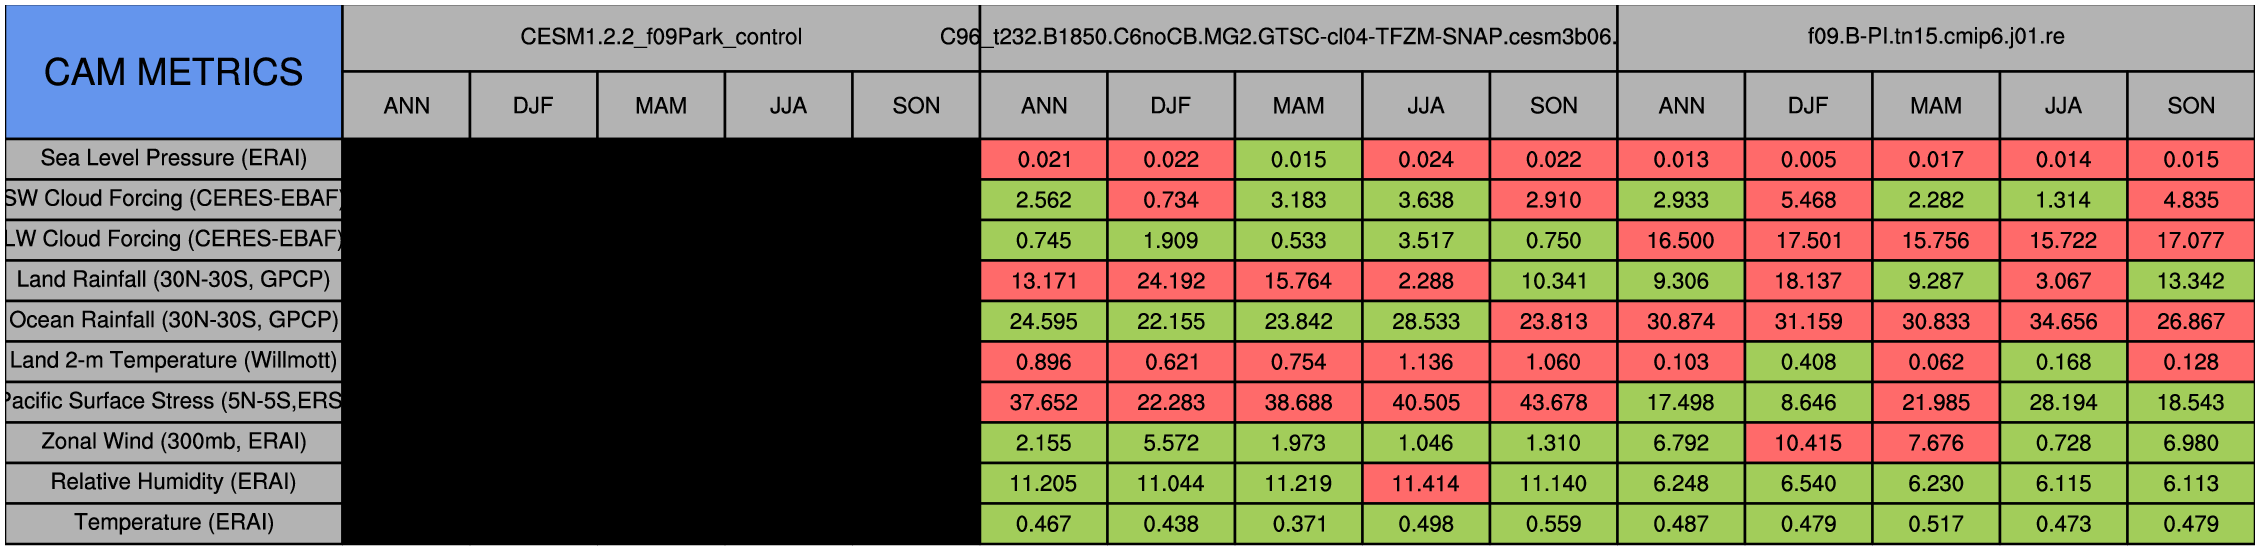
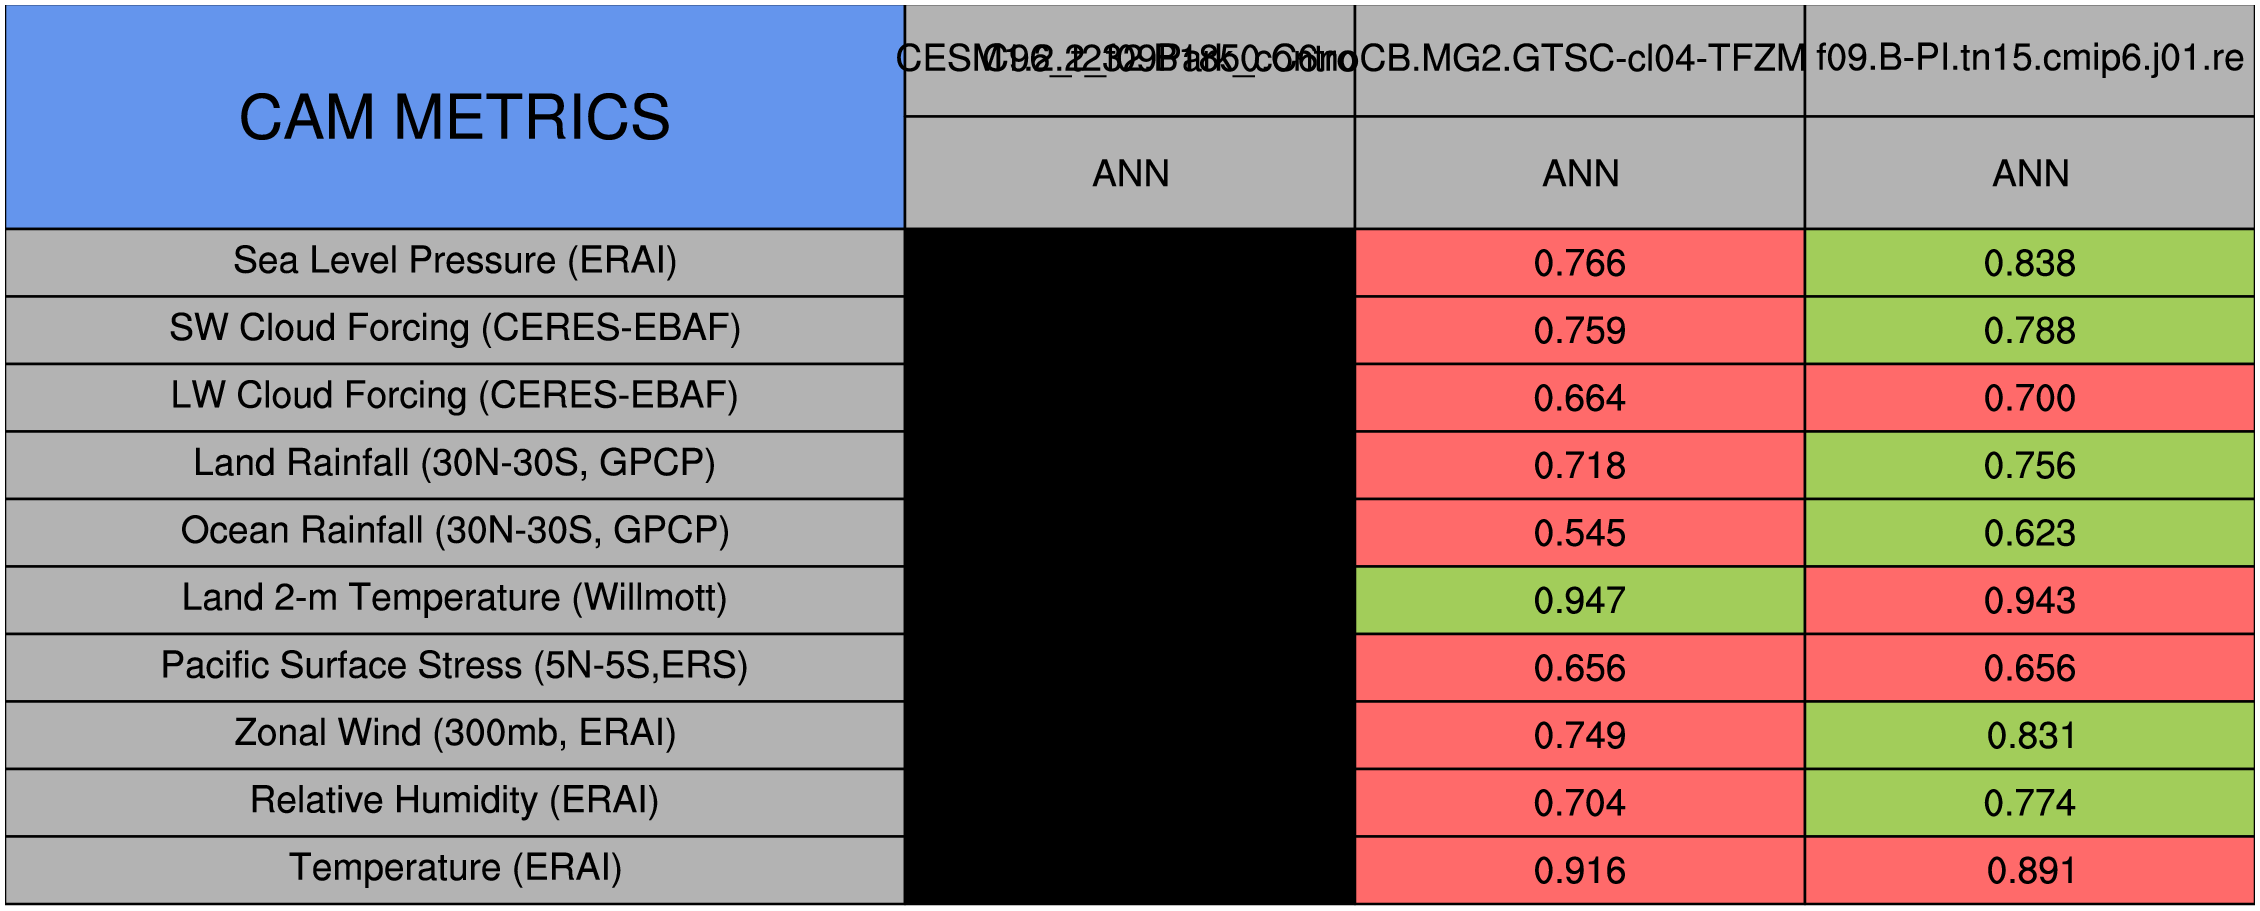
DIAG Set 14 - Taylor Diagrams
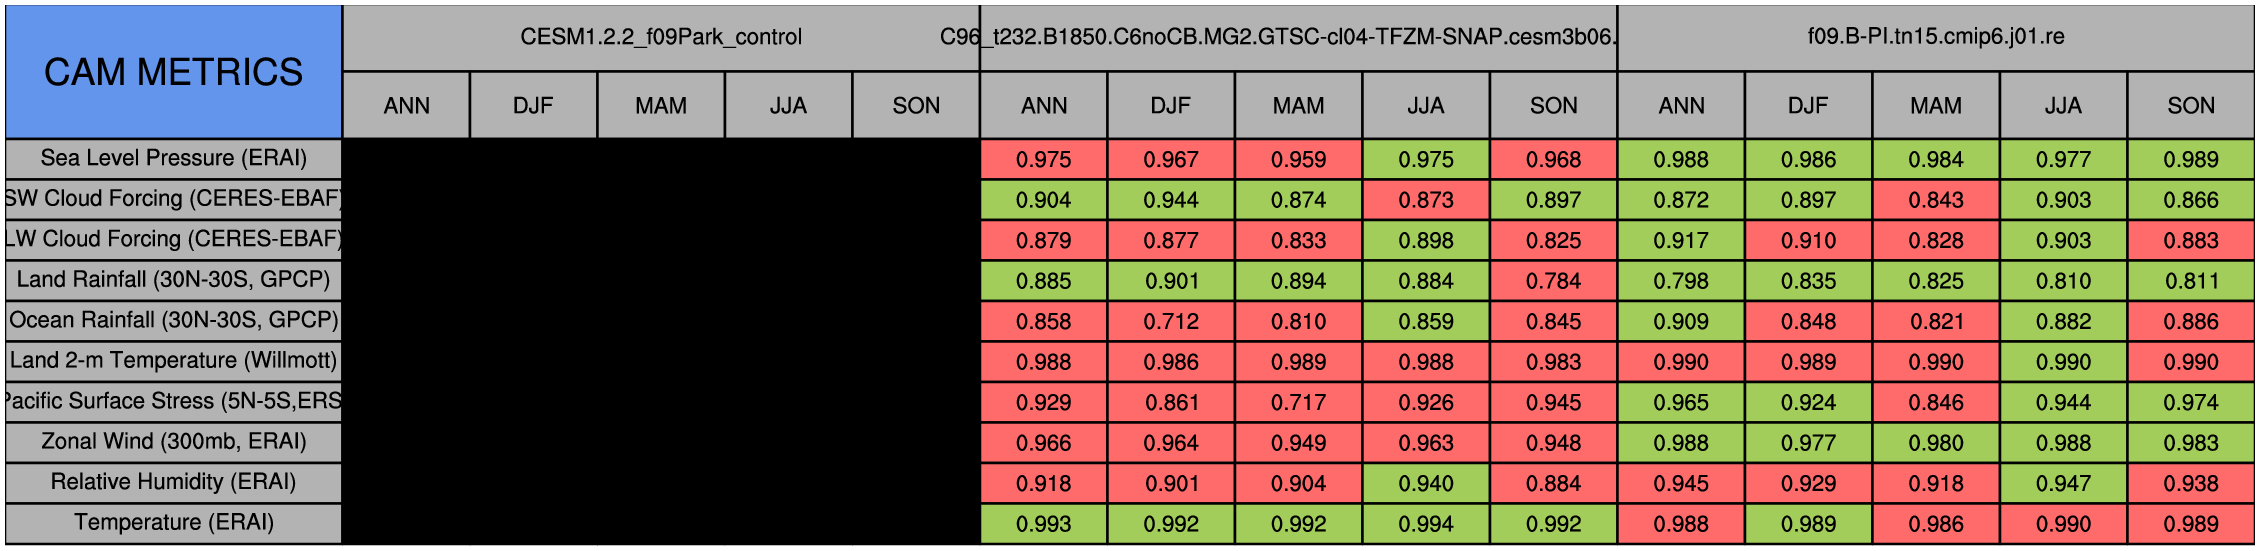
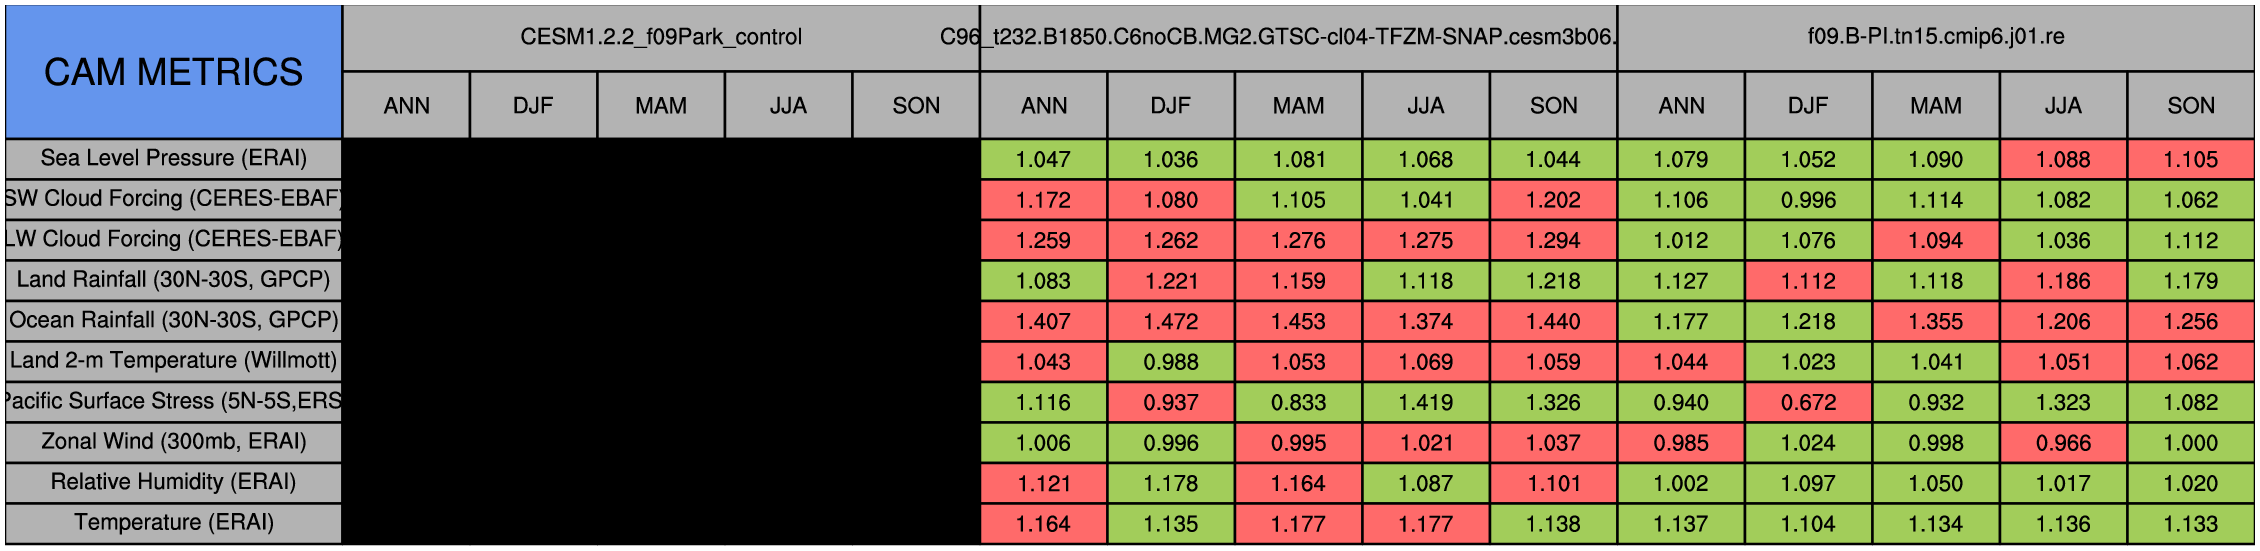
Taylor Diagrams were developed by Karl Taylor at PCMDI (paper|tech note) and aim to condense information about variance and RMSE characteristics of a particular model run when compared with observations in a single diagram. The tables summarize the individual metrics for each variable considered including:
| Space and time | ANN | ||||
|---|---|---|---|---|---|
| Space only | ANN | DJF | MAM | JJA | SON |
| Space and time | correlation | variance | bias |
|---|---|---|---|
| Space only | correlation | variancebias | |
| Time only | correlation |